Aviv Raizman,
Customer Success Manager at Dooblo
Estimated reading time: 9 minutes
Main topics
- Using termination statistics to understand project delays
- Improving progress through questions’ drop-off rate
- Incident rate as an indicator for duration & data quality
Kurtosis Research* is a market research company which is now conducting a fieldwork of a public opinion survey.
The survey contains a screening part and a main questionnaire with 20 questions. With a sample size of 500 individuals, the company set a deadline of 10 working days to complete the fieldwork. While the project’s deadline is getting close, fieldwork is significantly behind schedule, joining a series of considerable delays in completing several of its recent fieldwork projects. These delays have substantial financial and reputational impact as the company needs to deploy additional manpower to finish the fieldwork and monitor the quality of the data, while delaying the delivery of the final report to their client. With the company setting a goal to improve its Fieldwork policy, the Kurtosis’ team aims at understanding what holds down their fieldworks and how to optimize it for future projects.
Termination Statistics – Introduction
From the very first draft of our research, time is the main component to which we base our research plan: it allows us to price our service and plan resource allocation to complete it. In this sense, each passing day, an hour – sometimes even minutes, are crucial for our project to succeed.
A great deal of time is invested in recruiting the respondents who are eligible to take part in our survey: we design our screening questionnaire so it will allow subjects who are characterized by tendency of consumption, distribution of the sampled population or electoral map. Yet, in most cases we don’t have the means to calculate one’s probability to fit our survey, hence – collecting empirical data that will tell us whether or not our investment of time is being managed properly.
As we track our fieldwork’s progress, the key metric we usually keep our eyes on is the volume of interviews collected in a specific measure of time. Eventually, we will use this set of data collected from subjects who were eligible to take part in the survey, analyze it, create a report and design a presentation for our client.
While focusing on the complete interviews’ data, we disregard a piece of information that can have meaningful impact on our fieldwork’s success.
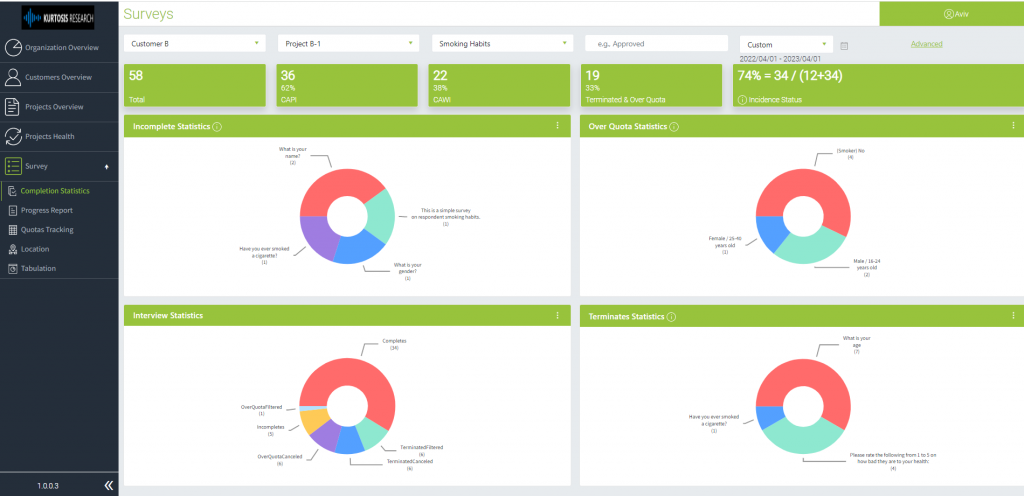
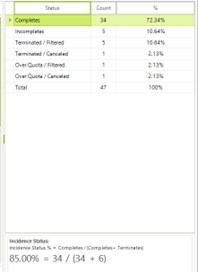
Adding the data from incomplete interviews to the existing data we investigate can help us to better understand how our resources are being invested. The statistics of your data in its various completion stages (completed and terminated) can be found in both STG Studio and Dooblo Insights, where you can filter the statistics by dates and statuses:
![]()

![]()

In order to identify the root-causes for Kurtosis’ project’s delay, this article will cover two solutions suggested through the inspection of termination statistics:
- Detecting the questions from which subjects were terminated.
- Measuring the success rate of your project to understand normal and abnormal growth of its progress.
Method 1: Reducing Dropoff Rates Through Question Optimization
Kurtosis’s questionnaire consists of two sections: screening and the main questionnaire. As the screening process determines who are the subjects that are eligible to participate in the survey, we would like to know which of these screening questions causes difficulties in recruiting respondents.
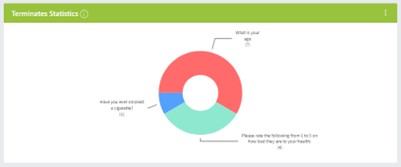
Assessing those problematic questions will shed light on the individuals who were terminated:
![]()
![]()

Such screening questions deal with frequency of consumption, level of likeliness to vote for a certain political candidate and more. In some cases, we may lower the degree of the screening criteria, allowing more subjects to take part in our project.
Beside these classifying questions, perhaps the most important question – “Will you agree to participate in our survey?” is a key indicator to measure the willingness of subjects to answer our survey. In this sense, comparing the termination rate of several different surveys with different descriptions (“a 10 minute survey”, “a short survey containing a few questions” and so on) will allow us to consider the right approach to describe our survey to potential respondents.
The drop-off rate is not the result of the questionnaire solely: identification of possible delay factors as well as quality issues can be achieved by reviewing the drop-off statistics across different surveyors or sample groups/panel companies. Being able to determine overall acceptable response rates can allow you to identify exceptions that may be related to specific surveyors, sampled groups or panel providers. Higher-than-average response rates can indicate quality issues caused by not following a specific recruitment process while lower response rates may indicate that additional training is required.
In conclusion, looking at the % of interviews that were terminated and where that happened during a project allows us to better understand if we need to make immediate changes to the survey and how to build our future questionnaires to reduce the drop-off rates, both in questions as well as the operational structure for future projects.
Method 2: Using Incident Rate to Create Benchmark for Success
In addition to identifying questions causing delays in recruitment, Kurtosis Research is also interested in improving its fieldwork policy by creating norms of fieldwork durations to have the precise amount of time needed for various types of projects. But how does duration reflect the quality of our data?
Ideally, we would want 100% of the respondents to match 100% of our screening. We, of course, know such a scenario doesn’t exist: the operations staff has always struggled with recruiting a specific target audience for any given project. This effort along with the time pressure require research agencies to invest great amounts of resources in this process, with human resources being the central one. The main goal is hence not only to achieve the volume of required responses, but also to ensure those results will be of a good quality and on time.
One can achieve this goal through the observation of a project’s Incident rate: the number of complete (eligible) results out of the entire poll of people who started the screening process but were terminated:

Using this equation, our focus will be on evaluating the fieldwork’s chain of efforts by distribution of Incident rate over a certain period. In this matter, an irregular rate, in research settings that were similar all through the data collection process, might point to inadequate behavior, such as fraud, committed in order to reach the targeted goal of the project while causing damage to the accuracy of the data.
The chart below demonstrates such anomaly: while in days 1-7 the incident rate was around ~30%-50%, the last 3 days of the fieldwork reach an Incident rate of ~90%:

![]()
Viewing incident rates over time can help us create a benchmark for success, as well as detecting irregular behaviors. Besides the distribution over time, one can examine Incident rate across different dimensions such as surveyors, different types of projects or platforms etc. Hence, when comparing the Incident rate differences, one can evaluate which operational functions are the most beneficial to complete the project and to plan them for future projects accordingly. On the other hand, the detection of irregular success rates can locate factors that appeal to our efforts to collect high-quality data.
Summary
In this article we presented a case of a research company dealing with delays in its fieldwork operations. As the company is interested in identifying the places that are causing the delays and in improving its fieldwork operations, we suggested viewing termination statistics as an additional set of data apart from the progress of complete results, using two methods.
One is to monitor the drop-off rate in specific questions, namely in the screening process. By identifying the points of deterrence, one may adjust the screening criteria and evaluate the willingness of subjects to participate in the survey.
The second is to inspect a project’s Incident rate over time to explain the efforts invested throughout the fieldwork and will help us to spot irregular behaviors in the recruitment process. By collecting the Incident rate over time, across different projects, one will learn what is the benchmark for fieldwork durations, as well as the key factors – such as surveyors, platform and the type of project – for a more accurate forecast of future successful projects.
Planning based on response rates and monitoring those response rates during a project while being able to drill down to what ‘composes the numbers’ can lead to an increase in the ability to define and meet project timelines, reduce the data collection related costs and improve the quality of the collected data.


